Introduction
In this blog, we will build a Generative AI application focused on Amazon Bedrock by using foundation models.
We will walk through a comprehensive guide using Python and the boto3 library to demonstrate AI Visualization and analysis with Data.
What is Generative AI?
Generative AI is a branch of artificial intelligence that can generate text, images, and audio in response to user prompts. It uses existing data to generate new and original outputs.
Building a generative AI application takes a lot of effort. It requires access to high-performing computational hardware and large-scale neural networks that can generate intelligent content in all aspects of the GenAI application, whether coding, SQL queries, or summarizing any text.
Generative AI applications must prioritize privacy and security when handling sensitive data and tasks.
Amazon Bedrock offers a robust solution for securing and scaling such applications in a seamless manner.
What is Amazon Bedrock?
Amazon Bedrock is an AWS AI platform that provides access to powerful foundational models (FMs) with just one simple API call. These models come from leading AI companies like AI21 Labs, Anthropics, Meta, Cohere, Stability AI, Mistral AI, etc.
Users also have the option to customize these models by fine-tuning them with their own data for AI visualization.
Bedrock makes it easy to build GenAI applications without a deep knowledge of machine learning. It helps you to do things like generate text, code completion, and question-answering, all with managed infrastructure. It offers the fastest and the most secure way to build advanced generative AI applications.
Before understanding the technicalities, let us break down the various offerings of Amazon Bedrock features which can be helpful for AI visualization with data:
Access to Top Foundation Models
Bedrock supports many foundational models like anthropic, cohere, meta, stability AI, and Amazon. Each of these models has its own strengths and specialties and some are good at AI Visualization with Data.
Vector DB Integration
It is easy to integrate Vector DB with Bedrock, especially for RAG setup.
Fine-Tuning Capabilities
AWS Bedrock helps to fine-tune the LLM for specific use cases just like AI Visualization.
Agents for AWS Bedrock
By agent, we can easily connect to company data sources and make greater prompts with relevant information.
Serverless
Bedrock provides a user-friendly serverless experience. You can easily integrate FM and deploy them in applications.
AI Visualization Code
To set up AWS sessions, I used AWS CLI and configured it with the necessary credentials for accessing AWS services.
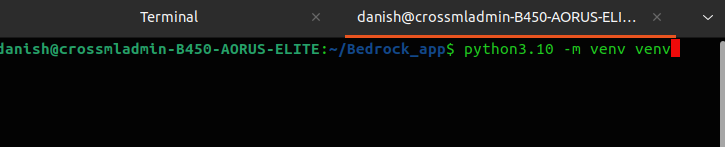
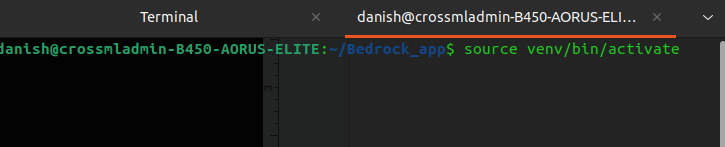
Step 1: Create a Virtual environment and activate
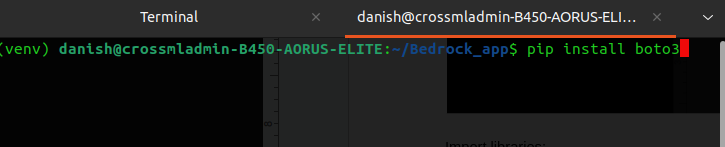
Step 2: Installing Required Packages
Before diving into the code, let’s ensure that we have the necessary packages installed to do AI Visualization.
Step 3: Importing Essential Libraries
					import boto3
import json
import pandas as pd
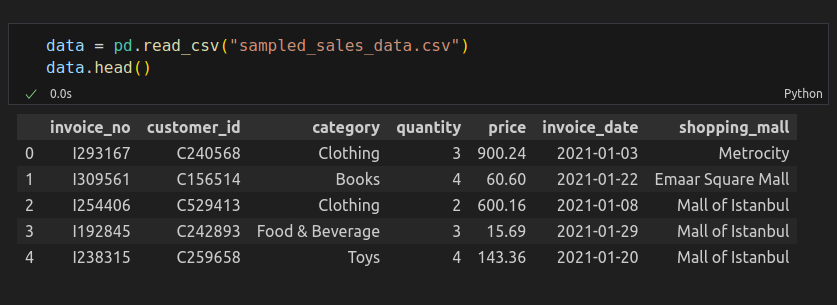
Step4: Load Sample Dataset: Open Source Dataset from Kaggle
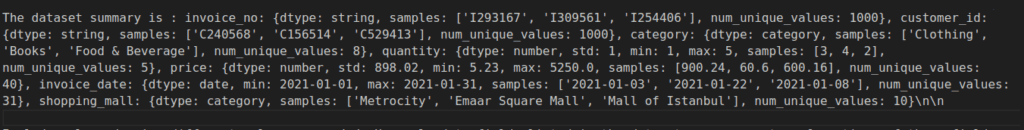
Step 5: Creating a Data Summary for Enhanced Understanding
Step 6: Prompt for LLM
					prompt_data=f"""
SYSTEM: You're a skilled assistant who excels in creating precise visualization CODE. Given a code template and data summary, complete the template to produce a VISUALIZATION. Your code should:

1. Achieve the specified goal.
2. Apply accurate transformations.
3. Choose suitable visualization types.
4. Use correct data encoding.
5. Ensure clear aesthetics, like readable axis labels.

Before writing, outline your approach:

- Decide on transformations (e.g., creating a new column).
- Identify relevant fields.
- Select the RIGHT VISUALIZATION TYPE.
- Determine necessary aesthetics.
- Ensure the code is ERROR-FREE, using appropriate field types

If you're identifying a single value, such as max, min, or median, highlight it on the chart with a line. Include a legend displaying this value rounded to two decimal places (0.2F).If using a <field> where semantic_type=date, YOU MUST APPLY the following transform before using that column i) convert date fields to date types using data[''] = pd.to_datetime(data[<field>], errors='coerce'), ALWAYS use  errors='coerce' ii) drop the rows with NaT values data = data[pd.notna(data[<field>])] iii) convert field to right time format for plotting.  ALWAYS make sure the x-axis labels are legible (e.g., rotate when needed) When completing the task, focus only on the <imports> and <stub> sections of the code.
Avoid writing data-loading code; the data is already in the 'data' variable. Skip using plt.show(). The plot method should return a matplotlib object (plt).

The dataset summary is : {data_summary}

HUMAN: Include a legend using different colors as needed. Use only data fields listed in the dataset summary or transformations of those fields. Limit usage to variables defined in the code or provided in the dataset summary. Return a complete Python program enclosed in triple backticks ``` starting with import statements. Avoid adding explanations.

Modify only the <imports> and <stub> sections of the template below to generate the solution:
'''import matplotlib.pyplot as plt
import pandas as pd
<imports>

def plot(data: pd.DataFrame):
   <stub>
   plt.title('', wrap=True)
   return plt

chart = plot(data)
'''

HUMAN: {User_query}. The finalized code based on the provided template is:

ASSISTANT:
"""
Step 7: Define Payloads and Invoke the LLM
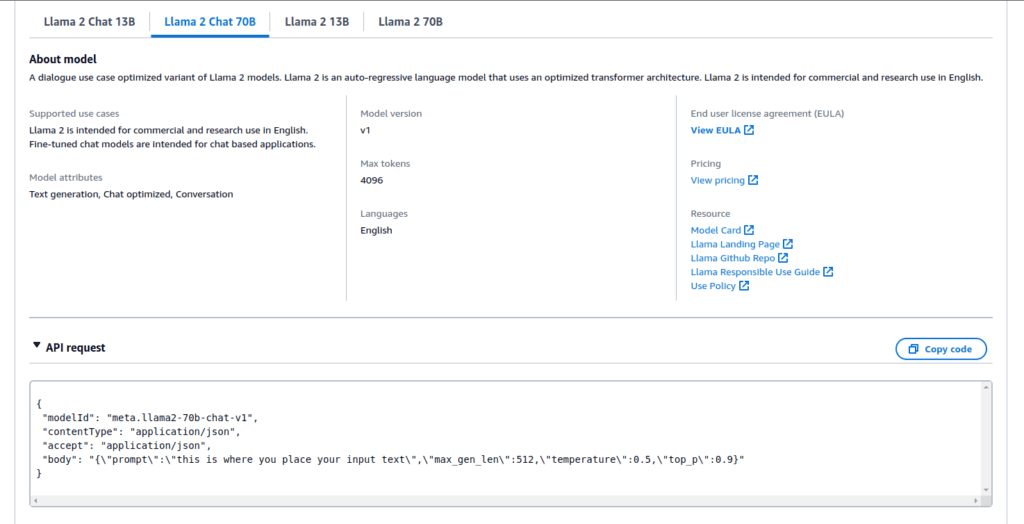
Define the payload with the prompt and other parameters, then invoke the Llama 2 chat model using the AWS Bedrock client:
					boto3_bedrock = boto3.client("bedrock-runtime")

payloads={
   "prompt": prompt_data,
   "max_gen_len": 400,
   "temperature":0.2,
   "top_p":0.9
					body=json.dumps(payloads)

model_id="meta.llama2-70b-chat-v1"
response=boto3_bedrock.invoke_model(
   body=body,
   modelId=model_id,
   accept="application/json",
   contentType="application/json"
)

response=json.loads(response.get("body").read())

print(f"Generated Text: {response['generation']}")
print(f"Prompt Token count:  {response['prompt_token_count']}")
print(f"Generation Token count:  {response['generation_token_count']}")
print(f"Stop reason:  {response['stop_reason']}")
User Query:
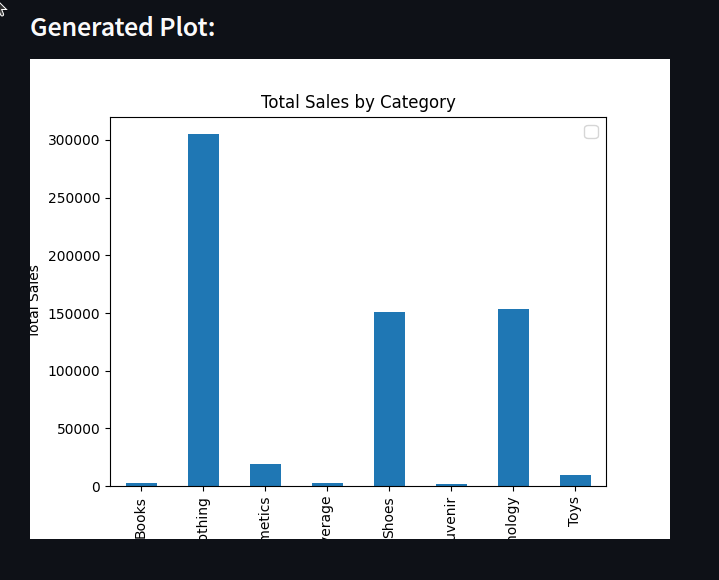
User_query = "Compare the total sales of each Category"
Step 8: Executing the Notebook.
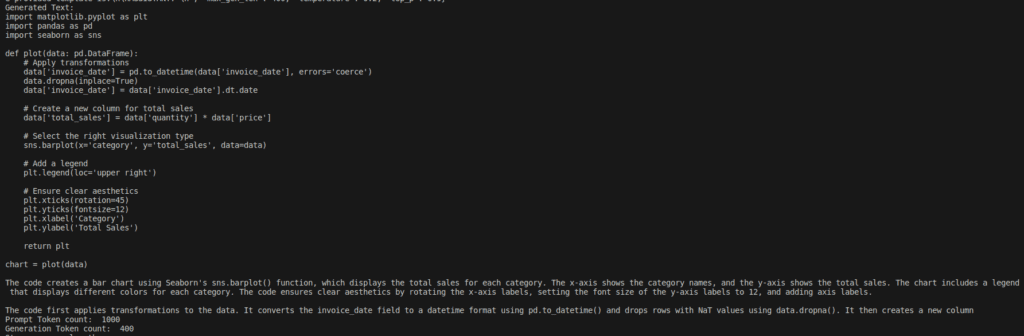
Step 9: Executing Bedrock-Generated Code for Validation
					import matplotlib.pyplot as plt
import pandas as pd
import seaborn as sns

def plot(data: pd.DataFrame):
   # Apply transformations
   data['invoice_date'] = pd.to_datetime(data['invoice_date'], errors='coerce')
   data.dropna(inplace=True)
   data['invoice_date'] = data['invoice_date'].dt.date

   # Create a new column for total sales
   data['total_sales'] = data['quantity'] * data['price']

   # Select the right visualization type
   sns.barplot(x='category', y='total_sales', data=data)

   # Add a legend
   plt.legend(loc='upper right')

   # Ensure clear aesthetics
   plt.xticks(rotation=45)
   plt.yticks(fontsize=12)
   plt.xlabel('Category')
   plt.ylabel('Total Sales')

   return plt

chart = plot(data)
Conclusion
In this blog, we worked with Amazon Bedrock Generative AI service for AI visualization while generating good insights from data. This was just a short implementation, which shows how powerful generative AI and Amazon Bedrock can be when communicating with data.
With services like Amazon Bedrock, businesses can gain better insights, make smarter decisions using LLMs and can come up with new and better strategies with the help of AI visualization.
FAQs
Amazon Bedrock simplifies AI visualization by converting complex data into clear and easy-to-understand visuals. Stable models save you time, and you can customize them for a specific need. It integrates smoothly with other tools.
With Generative AI, many tasks can be automated, such as data preparation and interpretation. It’s like a personal assistant for data analysis and visualization, which is able to generate more creative and helpful insights into data visualization.
Amazon Bedrock generates reports and customizes visualizations on user queries quickly. You can just ask it to perform an analysis. There is no need for hand-coding complex data pipelines, which frees you up to focus on strategic tasks.
Beginners can start by reading AWS blogs on Amazon Bedrock, where they can learn how to use foundation models for their specific use cases. Users also have the option to engage with the community for support and experiment with micro-projects, which will give the user a more hands-on experience.
The future of AI Visualization with generative techniques is very promising. As generative AI models evolve, they'll enable deeper insights and more effective data communication. User can easily communicate with his data, whether it is data visualization, summary or data insights.